1. Introduction
The World Health Organization (WHO) defines overweight and obesity as an abnormal
or excessive accumulation of fat that may impair health. In 2022, 2.5 billion adults
were classified as overweight, including 890 million who were obese [1]. Overweight and obesity arise from the interaction of genetic and environmental
factors and represent complex, multifactorial chronic conditions. These conditions
are strongly associated with multiple noncommunicable diseases (NCDs), such as type
2 diabetes, cardiovascular diseases, and certain types of cancer [2-4].
In the workplace, risk factors such as working more than 50 hours per week, night
shifts, high stress levels, disrupted sleep patterns, unhealthy eating habits, and
limited opportunities for physical activity contribute significantly to the development
of obesity [5-9]. Furthermore, low vitamin D levels have been linked to an increased inflammatory
response in individuals with obesity [10], while obesity itself increases the likelihood of vitamin D deficiency [11].
Evidence from meta-analyses of randomized clinical trials, including the large-scale
Vitamin D and Omega-3 Trial (VITAL), suggests limited benefits of vitamin D supplementation
on primary outcomes such as cancer and major cardiovascular events. However, secondary
analyses of the VITAL study revealed a significant interaction with baseline body
weight. Among participants with normal weight (body mass index (BMI) < 25.0, calculated
as weight in kilograms divided by height in meters squared), vitamin D supplementation
was associated with a 24% reduction in cancer incidence, a 42% reduction in cancer
mortality, and a 22% reduction in the incidence of autoimmune diseases. These benefits
were not observed in overweight or obese individuals [12].
Other critical factors in the assessment of obesity include waist circumference (WC),
a key anthropometric measure of abdominal obesity, which is strongly linked to the
risk of cardiovascular and metabolic diseases [13-15]. Visceral fat, in particular, is significantly associated with arterial stiffness,
underscoring its importance in cardiovascular health [16].
In addition, alcohol consumption has become widespread worldwide, contributing to
both health and social challenges. Alcohol, which provides 7.1 kcal (29 kJ) per gram,
can promote a positive energy balance, thereby increasing the risk of weight gain
when consumed in excess [17]. Collectively, these factors drive the rising prevalence of NCDs, contributing to
absenteeism and reduced labor productivity [18].
Despite the known risks, few studies have explored the prevalence of overweight, obesity,
and their associated factors among healthcare and non-healthcare workers in hospital
settings. This study aimed to estimate the prevalence of overweight and obesity and
to assess associated sociodemographic, clinical, and occupational factors among healthcare
and non-healthcare workers at an Ecuadorian oncology hospital.
2. Methodology
A cross-sectional observational study was conducted in 2023; data were collected from
September through December at the Sociedad de Lucha Contra el Cáncer (SOLCA), a cancer
hospital located in Guayaquil, Ecuador. The source population consisted of all healthcare
and non-healthcare workers registered at SOLCA at the start of the study period; in
this study, non-healthcare workers were defined as administrative workers. After applying
the exclusion criteria, eligible workers were invited to participate. Final inclusion
depended on voluntary acceptance through the signing of an informed consent form and
the availability of complete information for the study's primary variables.
Pregnant women and workers with medical conditions known to significantly affect body
weight- such as thyroid disorders, Cushing's syndrome, polycystic ovary syndrome,
or psychiatric disorders treated with medications that affect weight, including antipsychotics
or corticosteroids-were excluded in order to reduce confounding bias.
Data on workers were obtained from medical records and an adapted questionnaire (available
upon request to the author) based on national and international surveys in Spanish,
developed by the WHO and other institutions such as Ecuador's Ministry of Public Health
(MSP in spanish) and the Pan American Health Organization (PAHO). The questionnaires
used for adaptation were: Pan American Version of the Stepwise Approach to Public
Health (STEPS) Basic Questionnaire and Expanded Questionnaire to be administered in
Ecuador, May 2018 [19], Global Physical Activity Questionnaire (GPAQ) [20], the Quality of Life Questionnaire (WHOQOL-BREF) short version [21], and the Joint Report of the Food and Agriculture Organization of the United Nations
(FAO) and the WHO on Human Requirements for Vitamins and Minerals (FAO/WHO) [22].
Data were collected in an Excel spreadsheet during the workers' regular annual checkups
at the institution's occupational health department during the aforementioned data
collection months, and laboratory data were retrieved from medical records once the
results were available. Anthropometric measurements, including weight and height,
were taken using a primary care scale with an integrated digital stadiometer (Health-o-Meter,
model 502 KL). BMI was calculated using the formula: weight in kilograms divided by
height in meters squared. Waist circumference was measured using a SECA 201 ergonomic
tape measure, and body composition (visceral fat level, muscle mass percentage, and
total body fat percentage) was assessed using a calibrated OMRON scale (model HBF-514C),
based on the bioelectrical impedance method. Other variables related to overweight
and obesity were obtained from medical records and the aforementioned adapted WHO
questionnaire, including age, sex, alcohol and smoking, serum vitamin D levels, sun
exposure, sleep quality, and absenteeism. Variables derived from the questionnaire
were categorized according to the criteria established in the WHO instruments: STEPS,
GPAQ, WHOQOL-BREF, and FAO, as applicable. The operational definitions, cutoff points,
and specific sources for each variable are presented in Appendix 1.
The WHO, in accordance with the Centers for Disease Control and Prevention (CDC) and
the National Institutes of Health (NIH), defines the BMI (kg/m2) categories for adults aged 20 years and older as follows: underweight < 18.5; normal
weight 18.5-24.9; overweight 25.0-29.9; and obesity ≥ 30.0.
Overweight and obesity were described using frequencies and percentages. Statistical
analyses included chi-square tests, Student's t-tests, or Mann-Whitney U tests, as
appropriate. Binary logistic regression models, Poisson regression with robust variance,
and multiple linear regression were used to assess associations between various factors
and the variables of interest. A p-value < 0.05 was considered statistically significant,
and the assumptions of each statistical test were checked, including normality. All
analyses were performed using the statistical software SPSS (version 29) and Jamovi
(version 2.3.28). The study report followed the STROBE guidelines for cross-sectional
studies. Missing data were handled using pairwise deletion, so that each analysis
included all cases with available information for the corresponding variables. No
imputation of missing values was performed. The response rate for the adapted questionnaire
was calculated based on the number of participants who completed the survey relative
to the total number of eligible participants.
All participants signed an informed consent form prior to their inclusion in the study.
The protocol was approved by the Ethics Committee of the Kennedy Clinic (code HCK-CEISH-2023-013)
in Guayaquil, Ecuador, and the study was conducted in accordance with the principles
established in the Declaration of Helsinki. The data were analyzed anonymously and
de-identified, ensuring confidentiality and avoiding the use of names or other identifiable
information about the participants.
3. Results
At the start of the study, 1,430 workers were registered in SOLCA. Of these, 104 were
excluded because they had known medical conditions that could significantly influence
body weight, leaving an eligible population of 1,326 workers. A total of 653 workers
agreed to participate and signed the informed consent form, corresponding to a participation
rate of 49.2%. The remaining 673 workers did not participate in the study for various
reasons: lack of desire to participate (n = 485), vacation during the data collection
period (n = 130), sick leave (n = 15), and other/unspecified reasons (n = 43). Among
the participants who agreed to participate, 622 completed the questionnaire, representing
a questionnaire completion rate of 95.3%.
The frequency of missing data was assessed for the variables included in the analysis.
In the descriptive and bivariate analyses, an available-case analysis was used, so
the denominator varied depending on the variable or comparison being examined. For
the multivariable models-binary logistic regression, Poisson regression with robust
variance, and multiple linear regression-only participants with complete data for
the dependent variable and the covariates included in each model were included. The
effective sample size for each model was reported along with its respective results.
Of the 653 participants who agreed to take part, 220 were men (33.7%) and 433 were
women (66.3%); there was an approximate ratio of two women to every man among the
participants. The mean age was 34.2 ± 8.88 years; it was similar between both groups:
33.8 ± 8.97 for healthcare workers and 36.2 ± 8.14 for non-healthcare workers. The
median age was 32 (28-39) years old, with healthcare workers being five years younger
on average than non-healthcare workers. The greatest age difference was observed among
male healthcare workers (29 years) versus non-healthcare workers (37 years) compared
to female healthcare workers (32 years) versus non-healthcare workers (36 years).
Table 1 shows the characteristics of workers by job type. The age difference between job
types was statistically significant (p = 0.001).
Table 1
Characteristics of workers by job type
|
|
All Workers
|
Healthcare
|
Non-Healthcare
|
|
|
(N = 653)
|
(n = 553)
|
(n = 100)
|
|
|
N
|
%
|
N
|
%
|
N
|
%
|
|
Sex
|
|
|
|
|
|
|
|
Men
|
220
|
33.7
|
179
|
32.4
|
41
|
41.0
|
|
Women
|
433
|
66.3
|
374
|
67.6
|
59
|
59.0
|
|
Age {years}
|
653
|
|
|
|
|
|
|
Mean (s.d.) ¥ |
34,2
|
(8.88)
|
33.8
|
(8.97)
|
36.2
|
(8.14)
|
|
Median (IQR) *
|
32,0
|
(28-39)
|
31.0
|
(27-38)
|
36.0
|
(29-42)
|
|
BMI+ (kg/m2)
|
|
|
|
|
|
|
|
Underweight
|
4
|
0.6
|
4
|
0.7
|
0
|
0.0
|
|
Normal weight
|
160
|
24.5
|
140
|
25.3
|
20
|
20.0
|
|
Overweight
|
282
|
43.2
|
237
|
42.9
|
45
|
45.0
|
|
Obesity
|
207
|
31.7
|
172
|
31.1
|
35
|
35.0
|
|
Sun exposure
|
643
|
|
|
|
|
|
|
Yes
|
339
|
52.7
|
293
|
54.0
|
46
|
46.0
|
|
No
|
304
|
47.3
|
250
|
46.0
|
54
|
54.0
|
|
Physical activity
|
643
|
|
|
|
|
|
|
Vigorous
|
33
|
5.1
|
26
|
4.8
|
7
|
7.0
|
|
Moderate
|
157
|
24.4
|
130
|
23.9
|
27
|
27.0
|
|
Light
|
228
|
35.5
|
194
|
35.7
|
34
|
34.0
|
|
Sedentary
|
225
|
35.0
|
193
|
35.5
|
32
|
32.0
|
|
Smoking*
|
641
|
|
|
|
|
|
|
Yes
|
86
|
13.4
|
68
|
12.5
|
18
|
18.2
|
|
No
|
555
|
86.6
|
474
|
87.5
|
81
|
81.8
|
|
Alcohol*
|
635
|
|
|
|
|
|
|
Yes
|
442
|
69.6
|
366
|
68.2
|
76
|
77.6
|
|
No
|
193
|
30.4
|
171
|
31.8
|
22
|
22.4
|
|
Sleep quality6 |
641
|
|
|
|
|
|
|
Good
|
275
|
42.9
|
231
|
42.7
|
44
|
44.0
|
|
Regular
|
292
|
45.6
|
246
|
45.5
|
46
|
46.0
|
|
Poor
|
74
|
11.5
|
64
|
11.8
|
10
|
10.0
|
|
Vitamin D (ng/mL)
|
453
|
|
|
|
|
|
|
Deficiency (< 12)
|
15
|
3.3
|
12
|
3.1
|
3
|
4.3
|
|
Insufficiency (12 ~ < 20)
|
197
|
43.5
|
162
|
42.2
|
35
|
50.7
|
|
Sufficiency ( ≥ 20)
|
235
|
51.9
|
206
|
53.6
|
29
|
42.0
|
|
Risk of Toxicity (>100)
|
6
|
1.3
|
4
|
1.0
|
2
|
2.9
|
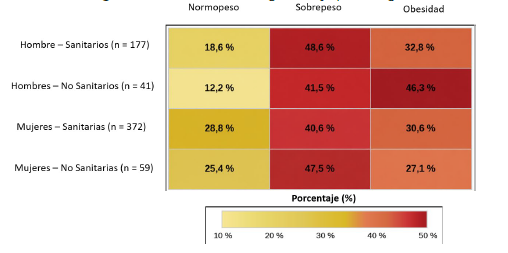
A total of 74.9% of workers were classified as being overweight or obese, of whom
43.2% were overweight and 31.7% had obesity. Figure 1 shows the distribution of BMI by sex and job type.
Figure 1
Distribution of BMI by sex and job type.
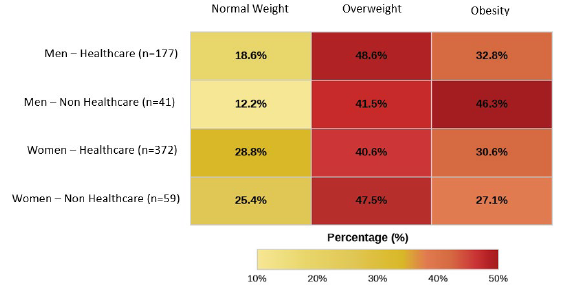
No statistically significant differences were observed between BMI and job type (p
= 0.26). The prevalence of overweight was similar among healthcare workers (43.2%)
and non-healthcare workers (45%), as was the prevalence of obesity (31.3% vs. 35%),
with no significant differences. Similarly, no significant differences were found
between job type and variables such as sex, physical activity level, sleep quality
in the past month, sun exposure, serum vitamin D concentration, or smoking and alcohol
use in the past 12 months.
In the comparative analysis, no statistically significant differences were observed
in alcohol consumption between healthcare and non-healthcare workers (68.2% vs. 77.6%;
p = 0.06), nor in the proportion with normal vitamin D levels (53.6% vs. 42.0%; p
= 0.07). However, healthcare workers had a lower frequency of alcohol consumption
and a higher proportion of normal vitamin D levels. In the total sample, there was
a high prevalence of vitamin D insufficiency (43.5%) and deficiency (3.3%).
Using Student's t-test, significant differences were identified between job type and
certain anthropometric measurements:
Waist circumference (n = 648): Healthcare workers had a mean value of 91.2 cm, compared
with 94.6 cm among non-healthcare workers (p = 0.01), with a small effect size (Cohen's
d = 0.27; 95% CI: 0.06-0.49).
Visceral fat level: healthcare workers had a mean level of 8.3, while non-healthcare
workers had 9.5 (p = 0.01), with a small to moderate effect size (Cohen's d = 0.32;
95% CI: 0.10-0.53).
No significant differences were found in the annual absenteeism rate between the two
job types, according to the Mann-Whitney U test.
The effective sample size varies depending on the availability of data for each variable.
In the descriptive and bivariate analyses, data were available for 635 to 653 participants
for most variables; specifically, sex, age, and BMI were available for 653 workers,
sun exposure and physical activity for 643, smoking and sleep quality for 641, alcohol
consumption for 635, and waist circumference for 648. The main exception was vitamin
D, which was available for 453 workers. In the multivariable models, the complete-case
analysis reduced the effective sample size to 366-367 participants, as detailed in
Appendices 2 and 3.
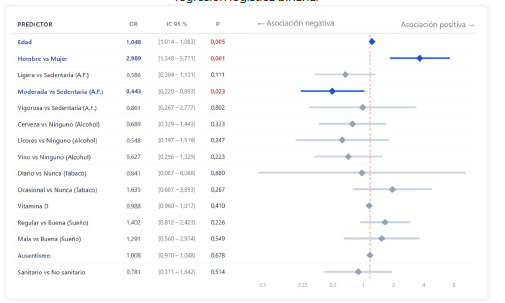
In the binary logistic regression analysis, statistically significant factors associated
with higher odds of being overweight or obese were identified (Figure 2).
Figure 2
Forest plot of factors associated with overweight/obesity using binary logistic regression.
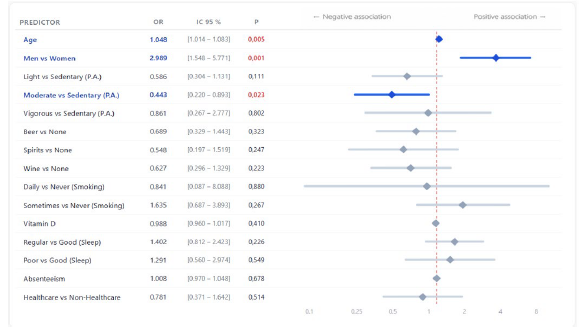
Note: The estimators represent the log odds of "overweight/obesity = yes" versus "overweight/obesity
= no." Logarithmic scale. P.A. = physical activity.
Each additional year of age was associated with a 4.8% increase in the odds of being
overweight or obese (OR = 1.048; 95% CI: 1.014-1.083; p = 0.005). Similarly, men had
approximately three times the odds of being overweight/obese compared with women (OR
= 2.989; 95% CI: 1.548-5.771; p = 0.001). Compared with a sedentary lifestyle, moderate
physical activity was associated with lower odds of being overweight/obese (OR = 0.443;
95% CI: 0.220-0.893; p = 0.023); however, vigorous physical activity was not associated,
likely due to the small number of workers in this category, which could limit precision.
No significant associations were observed with type of alcohol consumed, smoking frequency,
vitamin D level, sleep quality, absenteeism, or job type (p > 0.05 in all cases).
Overall, the model was globally significant (X2= 27.1; df = 15; p = 0.028), although its explanatory power was modest (McFadden's
R2 = 0.067; Nagelkerke's R2 = 0.107). The model included n = 367 participants with complete data for the dependent
variable and all included covariates.
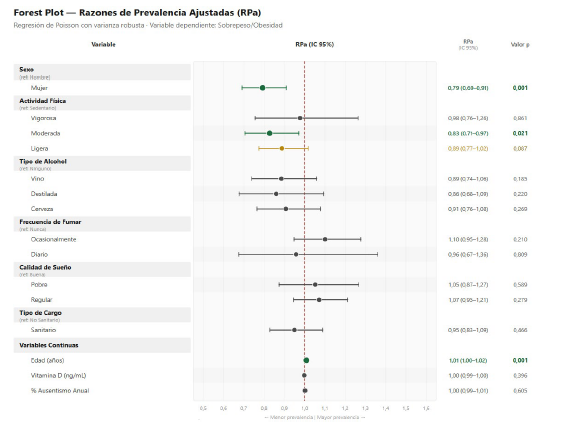
Given that the primary outcome had a high prevalence, Poisson regression with robust
variance (Figure 3) was used-and is therefore considered the primary analysis-to estimate adjusted prevalence
ratios (aPR) and 95% confidence intervals. Binary logistic regression was initially
used to explore associations, but odds ratios were interpreted with caution because,
for common outcomes, they may overestimate the magnitude of the association compared
to prevalence ratios.
Figure 3
Forest plot of factors associated with overweight/obesity using Poisson regression
with robust variance.
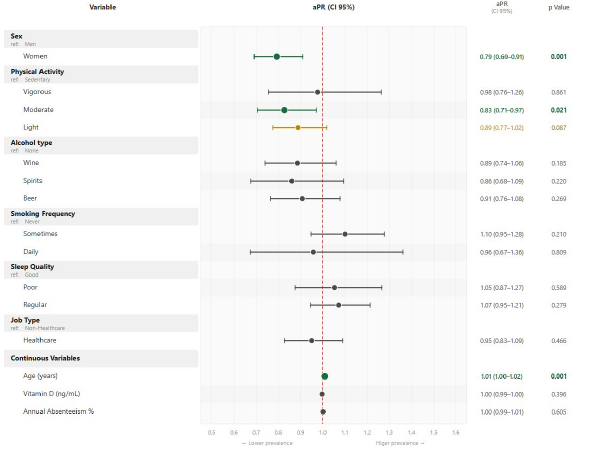
In the multivariable Poisson regression model (n = 367) with robust variance, adjusted
for sex, physical activity, type of alcohol, smoking frequency, sleep quality, job
type, age, vitamin D, and annual absenteeism rate, women had a lower prevalence ratio
of overweight/obesity compared with men (aPR: 0.79; 95% CI: 0.69-0.91; p = 0.001).
Likewise, age was positively associated with the outcome, with a 0.9% increase in
the prevalence ratio for each additional year of age (aPR: 1.009; 95% CI: 1.004-1.015;
p = 0.001). Although the overall effect of physical activity was not statistically
significant (p = 0.102), the moderate physical activity category showed a lower prevalence
ratio for overweight/obesity compared with the sedentary group (aPR: 0.83; 95% CI:
0.71-0.97; p = 0.021). As in the logistic regression model, vigorous physical activity
was not associated, likely due to the small number of workers in this category, which
could limit precision. No statistically significant associations were observed with
type of alcohol consumed, smoking frequency, sleep quality, job type, vitamin D level,
or annual absenteeism rate. Appendix 2 shows the effective N and missing data by variable for this Poisson regression analysis.
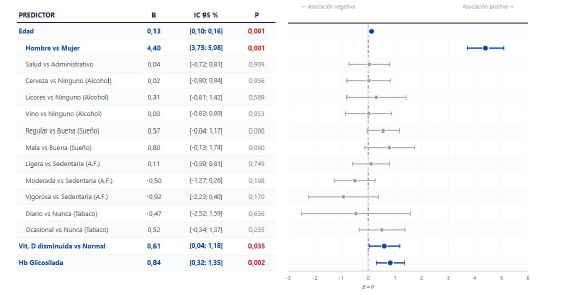
After testing the assumptions, a multiple linear regression analysis was performed
to determine which variables were associated with visceral fat levels (Figure 4).
Figure 4
Coefficient plot of factors associated with visceral fat level using multiple linear
regression.
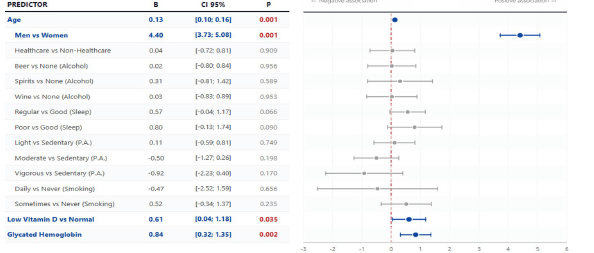
Note: The ß coefficients represent the change in visceral fat level for each unit
increase in the associated factor. P.A. = physical activity; Hb = hemoglobin.
In the multiple linear regression model, age was positively associated with visceral
fat level, with an average increase of 0.13 points for each additional year of age
(B = 0.1295; 95% CI: 0.0970 to 0.1620; p < 0.001). Likewise, men were associated with
an average increase of 4.40 points in visceral fat level compared with women (B =
4.4049; 95% CI: 3.7289 to 5.0810; p < 0.001). Low vitamin D level (< 20 ng/ mL, including
both insufficiency and deficiency), compared with normal level, was also associated
with higher average visceral fat values, although with a less precise estimate and
close to zero (B = 0.6107; 95% CI: 0.0423 to 1.1790; p = 0.035). Similarly, glycated
hemoglobin was positively associated with visceral fat level (B = 0.8384; 95% CI:
0.3222 to 1.3550; p = 0.002). No statistically significant associations were observed
for job type, type of alcohol, physical activity, smoking frequency, or sleep quality.
In particular, the categories of regular sleep quality (p = 0.06) and poor sleep quality
(p = 0.09), compared with good sleep quality, had confidence intervals that included
the null value; therefore, they were not considered statistically significantly associated
with visceral fat level. The model explained 44.9% of the variability in visceral
fat level (R2 = 0.449). The overall fit was significant (F (15.350) = 19.0; p < 0.001).
The analysis was performed with n = 366 participants with complete data for the dependent
variable and the associated factors included in the model. Appendix 3 shows the effective sample size and missing data by variable for this multiple linear
regression analysis.
4. Discussion
This study examined the prevalence of overweight and obesity, as well as associated
factors among healthcare and non-healthcare workers at a cancer hospital in Ecuador.
The findings indicate a high prevalence of overweight and obesity (74.9%), consistent
with global trends observed among healthcare workers [1,23]. Despite the absence of significant differences in BMI by job type, disparities
in waist circumference and visceral fat level underscore the importance of implementing
targeted interventions to reduce central obesity among non-healthcare workers.
The high prevalence of overweight and obesity is comparable to that reported in regional
studies in Latin America, where these conditions have reached epidemic levels due
to lifestyle changes, including a sedentary lifestyle and unhealthy dietary patterns
[24,25]. Among healthcare workers, the prevalence of obesity was higher than that reported
in other hospital settings [26-29], which may reflect regional trends.
Interestingly, no significant associations were found between job type and factors
such as physical activity levels, sleep quality, or serum vitamin D concentrations.
However, trends toward lower alcohol consumption and higher vitamin D levels among
healthcare workers may indicate modest differences in lifestyle. The high overall
prevalence of vitamin D insufficiency (43.5%) and deficiency (3.3%) is consistent
with findings from other studies, thus highlighting the global challenge of addressing
hypovitaminosis D [30,31]. Evidence suggests that vitamin D plays a critical role in metabolic health and
that its deficiency may exacerbate inflammation and increase the risk of obesity-related
comorbidities [32].
Logistic regression and Poisson regression with robust variance identified age and
sex as factors associated with overweight and obesity, albeit with limited precision.
These findings are consistent with the literature, which shows that age and sex influence
not only the distribution and expression of adiposity but also the magnitude and pattern
of associated cardiometabolic risk, including metabolic syndrome, hypertension, diabetes,
and dyslipidemia [33-36].
In the multiple linear regression analysis, age and sex were independently associated
with visceral fat levels. Furthermore, vitamin D levels showed an inverse association
with visceral fat levels, such that lower vitamin D concentrations were associated
with higher visceral fat levels, after adjusting for the other variables included
in the model. This finding is consistent with previous research that has described
associations between vitamin D status, adiposity, and inflammatory processes [37-39]. However, due to the cross-sectional design of the study, these results should be
interpreted as associations and do not allow for establishing causality or attributing
a protective effect of vitamin D on visceral fat. Longitudinal or intervention studies
are required to clarify the direction and possible mechanisms of this relationship.
The lack of significant differences in absenteeism rates between healthcare and non-healthcare
workers may reflect shared occupational stressors or common challenges within the
hospital setting. However, the small to moderate effect sizes observed for waist circumference
and visceral fat level across job types highlight the need to implement tailored workplace
wellness programs that address the specific needs of healthcare and non-healthcare
workers.
However, obesity is a multifactorial phenomenon involving biological, behavioral,
environmental, and social determinants. Therefore, although some variables in the
present study showed an association with overweight/obesity, the model's explanatory
power was limited, suggesting that other unmeasured factors could also contribute
to the outcome, such as dietary patterns, energy balance, genetic predisposition,
stress, working conditions, and other environmental determinants.
4.1 Strengths and Limitations
The study's strengths include an adequate sample size to describe the characteristics
of the participating workers, a rigorous methodology, and the use of validated tools
for anthropometric and body composition measurements. However, certain limitations
must be acknowledged. The cross-sectional design precludes causal inferences, and
reliance on self-reported data for some variables, such as physical activity and alcohol
consumption, may introduce bias. Future longitudinal studies are needed to establish
causal relationships and explore the impact of targeted interventions on the health
outcomes of healthcare and non-healthcare staff.
An inherent limitation of our study is that it relied exclusively on BMI as an indicator
of excess weight. In January 2025, the Editorial Board of The Lancet Diabetes & Endocrinology
[40] published a new diagnostic framework that distinguishes "preclinical obesity" from
"clinical obesity," incorporating fat distribution and the presence of organ dysfunction
to define the disease. Our results remain valid for estimating the magnitude of the
problem in 2023; however, future studies should apply these expanded criteria to more
accurately identify the burden of clinical obesity and guide targeted interventions.
Another significant limitation of the study was the considerable proportion of eligible
workers who did not participate. Although the questionnaire completion rate was high
among those who agreed to participate, the participation rate relative to the eligible
population was 49.2%. This could introduce nonresponse bias if the workers who did
not participate differed systematically from the participants in variables related
to nutritional status, cardiometabolic risk, sex, age, occupation type, or health
habits.
It was not possible to compare the characteristics of participants and non-participants
due to the lack of individual data available for workers who declined to participate.
Consequently, the results should be interpreted with caution, and their generalizability
to all workers at the institution may be limited. However, the final sample included
both healthcare and non-healthcare staff, which allowed us to explore differences
between occupational groups within the participating population.
Another limitation of the study was that the level of visceral fat estimated by the
OMRON HBF-514C was treated as a continuous dependent variable in the multiple linear
regression model, even though it corresponds to an ordinal scale with 1 to 30 levels
rather than an actual percentage of visceral fat. This decision may affect the interpretation
of the coefficients, given that differences between consecutive levels do not necessarily
represent equivalent changes in actual visceral fat. Results of the multivariate model,
conducted on 366 participants, should be interpreted with caution as an exploratory
approximation of the factors associated with visceral fat levels.
Finally, a major limitation was the amount of missing data in some variables. We used
a "censored cases" approach for descriptive and bivariate analyses, and a "complete
cases" approach for multivariate models. Consequently, the effective sample size varied
across analyses. This approach may reduce statistical precision and introduce bias
if the missing data were not randomly distributed.
5. Conclusions
It is suggested that future studies be conducted to evaluate interventions aimed at
reducing the burden of overweight and obesity among hospital workers, given the high
prevalence observed in this population. Furthermore, based on the findings of prospective
cohorts, these intervention or follow-up studies should consider strategies aimed
at promoting physical activity, improving dietary habits, and addressing vitamin D
deficiency, the high prevalence of which was also evident in the present study.
Similarly, in line with the literature, tailored interventions targeting groups with
larger waist circumferences and higher levels of visceral fat such as non-healthcare
workers-could yield health benefits and help improve workplace productivity. Overweight
and obesity showed a consistent association with age and sex, identifying men and
older workers as groups with a higher burden of these conditions. Although the cross-sectional
design precludes inferring causality, these results can guide institutional strategies
for cardiometabolic prevention and monitoring focused on groups with the highest prevalence.
1. Introducción
La Organización Mundial de la Salud (OMS) define el sobrepeso y la obesidad como una
acumulación anormal o excesiva de grasa que puede perjudicar la salud. En 2022, 2500
millones de adultos fueron clasificados con sobrepeso, incluidos 890 millones con
obesidad [1]. El sobrepeso y la obesidad surgen de la interacción entre factores genéticos y
ambientales, y representan condiciones crónicas complejas y multifactoriales. Estas
condiciones están fuertemente asociadas con múltiples enfermedades no transmisibles
(ENT), como la diabetes tipo 2, las enfermedades cardiovasculares y ciertos tipos
de cáncer [2-4].
En el entorno laboral, factores de riesgo como trabajar más de 50 horas por semana,
los turnos nocturnos, los altos niveles de estrés, los patrones de sueño alterados,
los hábitos alimentarios desequilibrados y las oportunidades limitadas para la actividad
física contribuyen significativamente al desarrollo de la obesidad [5-9]. Además, los niveles bajos de vitamina D se han vinculado con una respuesta inflamatoria
aumentada en individuos con obesidad [10], mientras que la obesidad en sí incrementa la probabilidad de deficiencia de vitamina
D [11].
La evidencia proveniente de metaanálisis de ensayos clínicos aleatorizados, incluido
el ensayo a gran escala Vitamin D and Omega-3 Trial (VITAL), sugiere efectos limitados
de la suplementación con vitamina D sobre desenlaces primarios como el cáncer y los
eventos cardiovasculares mayores. Sin embargo, los análisis secundarios del estudio
VITAL revelaron una interacción significativa con el peso corporal basal. Entre los
participantes con peso normal (índice de masa corporal [IMC] < 25,0, calculado como
el peso en kilogramos dividido por la talla en metros al cuadrado), la suplementación
con vitamina D se asoció con una reducción del 24 % en la incidencia de cáncer, una
reducción del 42 % en la mortalidad por cáncer y una reducción del 22 % en la incidencia
de enfermedades autoinmunes. Estos beneficios no se observaron en individuos con sobrepeso
u obesidad [12].
Otros factores críticos en la evaluación de la obesidad incluyen la circunferencia
de cintura, una medida antropométrica clave de la obesidad abdominal, que está fuertemente
vinculada con el riesgo de enfermedades cardiovasculares y metabólicas [13-15]. La grasa visceral, en particular, se asocia significativamente con la rigidez arterial,
lo que subraya su importancia en la salud cardiovascular [16].
Además, el consumo de alcohol se ha generalizado a nivel mundial, y ha contribuido
tanto a desafíos sociales como de salud. El alcohol, que aporta 7,1 kcal (29 kJ) por
gramo, puede promover un balance energético positivo, lo que incrementa el riesgo
de aumento de peso cuando se consume en exceso [17]. Estos factores impulsan colectivamente el aumento de la prevalencia de ENT y ocasionan
el ausentismo y la reducción de la productividad laboral [18].
A pesar de los riesgos conocidos, existen pocos estudios que hayan explorado la prevalencia
del sobrepeso, la obesidad y sus factores asociados entre personal sanitario y no
sanitario en entornos hospitalarios. Por tanto, el objetivo de este estudio fue determinar
la prevalencia de sobrepeso y obesidad, así como evaluar los factores sociodemográficos,
clínicos y laborales asociados, en el personal sanitario y no sanitario de un hospital
oncológico ecuatoriano.
2. Metodología
Se realizó un estudio observacional transversal en 2023. Los datos se recolectaron
de septiembre a diciembre, en la Sociedad de Lucha Contra el Cáncer (SOLCA), un hospital
oncológico ubicado en Guayaquil, Ecuador.
La población fuente estuvo constituida por el personal sanitario y no sanitario (el
personal no sanitario fue definido en este estudio como trabajadores administrativos)
registrados en SOLCA al inicio del periodo de estudio. Tras aplicar los criterios
de exclusión, se invitó a participar al personal elegible. La inclusión final dependió
de la aceptación voluntaria mediante firma del consentimiento informado y de la disponibilidad
de información completa para las variables principales del estudio.
Se excluyeron mujeres embarazadas y trabajadores con condiciones médicas conocidas
por influir significativamente en el peso corporal, como trastornos tiroideos, síndrome
de Cushing, síndrome de ovario poliquístico o trastornos psiquiátricos tratados con
medicamentos que alteran el peso, incluidos antipsicóticos o corticosteroides, con
el fin de reducir el sesgo de confusión.
Los datos de los trabajadores se obtuvieron a partir de historias clínicas y de un
cuestionario adaptado (disponible a petición del lector al autor) de encuestas nacionales
e internacionales en español, desarrollado por la OMS y otras instituciones como el
Ministerio de Salud Pública (MSP) de Ecuador y la Organización Panamericana de la
Salud (OPS). Los cuestionarios usados para la adaptación fueron la Versión Panamericana
del Instrumento del método progresivo (STEPS); Cuestionario básico y cuestionario
ampliado a aplicarse en Ecuador, mayo de 2018 [19]; Cuestionario Mundial de Actividad Física (GPAQ) [20]; el Cuestionario de Calidad de Vida (WHOQOL-BREF) versión corta [21], y el Informe conjunto de la Organización de las Naciones Unidas para la Alimentación
y la Agricultura (FAO) y la OMS de los Requerimientos Humanos de Vitaminas y Minerales
(FAO/OMS) [22].
Los datos se recopilaron durante la consulta anual de control realizada a los trabajadores
en el Departamento de Salud Ocupacional de la institución entre septiembre y diciembre
de 2023. La información obtenida fue registrada en una base de datos de Microsoft
Excel. Los resultados de laboratorio se extrajeron de las historias clínicas una vez
que estuvieron disponibles y fueron incorporados al registro institucional. Las mediciones
antropométricas, incluidas peso y talla, se realizaron utilizando una balanza de atención
primaria con estadiómetro digital integrado (Health o meter, modelo 502 KL). El IMC
se calculó mediante la fórmula: peso en kilogramos dividido por la talla en metros
al cuadrado. La circunferencia de cintura se midió con una cinta ergonómica SECA 201
y la composición corporal (nivel de grasa visceral, porcentaje de masa muscular y
porcentaje de grasa corporal total) se evaluó mediante una balanza OMRON calibrada
(modelo HBF-514C), basada en el método de bioimpedancia eléctrica. Otras variables
relacionadas con el sobrepeso y la obesidad se obtuvieron de las historias clínicas
y del cuestionario adaptado de la OMS previamente mencionado, incluidos edad, sexo,
consumo de alcohol y tabaco, niveles séricos de vitamina D, exposición solar, calidad
del sueño y ausentismo. Las variables derivadas del cuestionario fueron categorizadas
de acuerdo con los criterios establecidos en los instrumentos OMS: STEPS, GPAQ, WHOQOL-BREF
y FAO, según correspondiera. Las definiciones operacionales, puntos de corte y fuentes
específicas de cada variable se presentan en el Anexo 1.
La OMS, en concordancia con los Centers for Disease Control and Prevention (CDC) y
los National Institutes of Health (NIH), define las categorías de IMC (kg/m2) para adultos ≥ 20 años de la siguiente manera: bajo peso < 18,5; peso normal 18,5-24,9;
sobrepeso 25,0-29,9; y obesidad ≥ 30,0.
El sobrepeso y la obesidad se describieron mediante frecuencias y porcentajes. Los
análisis estadísticos incluyeron pruebas de ji al cuadrado, pruebas t de Student o
pruebas U de Mann-Whitney, según correspondiera. Se emplearon modelos de regresión
logística binaria, regresión de Poisson con varianza robusta y regresión lineal múltiple
para evaluar asociaciones entre diversos factores y las variables de interés. Se consideró
estadísticamente significativo un valor de p < 0,05 y se comprobaron los supuestos
de cada prueba estadística, incluida su normalidad. Todos los análisis se realizaron
utilizando los paquetes estadísticos SPSS (versión 29) y Jamovi (versión 2.3.28).
En el reporte del estudio se siguieron las directrices STROBE para estudios transversales.
Los datos faltantes se manejaron mediante eliminación por pares (pairwise deletion), de modo que cada análisis incluyó todos los casos con información disponible para
las variables correspondientes. No se realizó imputación de valores perdidos. La tasa
de respuesta al cuestionario adaptado aplicado se calculó con base en el número de
participantes que completaron la encuesta respecto al total de participantes elegibles.
Todos los participantes firmaron un consentimiento informado antes de su inclusión
en el estudio. El protocolo fue aprobado por el Comité de Ética de la Clínica Kennedy
(código HCK-CEISH-2023-013) en Guayaquil, Ecuador, y el estudio se realizó de acuerdo
con los principios establecidos en la Declaración de Helsinki. Los datos se analizaron
de forma anónima y desvinculada, garantizando la confidencialidad y evitando el uso
de nombres u otra información identificable de los participantes.
3. Resultados
Al inicio del estudio, 1430 trabajadores estaban registrados en SOLCA. De ellos, 104
fueron excluidos por presentar condiciones médicas conocidas que podían influir significativamente
en el peso corporal, por lo que la población elegible quedó conformada por 1326 trabajadores.
Un total de 653 trabajadores aceptó participar y firmó el consentimiento informado,
lo que correspondió a una tasa de participación del 49,2 %. Los 673 trabajadores restantes
no participaron en el estudio por diferentes razones: falta de deseo de participar
(n = 485), vacaciones durante el período de recolección de datos (n = 130), permiso
médico por enfermedad (n = 15) y otras razones/no especificadas (n = 43). Entre los
participantes que aceptaron, 622 completaron el cuestionario, lo que representó una
tasa de completitud del cuestionario del 95,3 %.
Se evaluó la frecuencia de datos faltantes para las variables incluidas en el análisis.
En los análisis descriptivos y bivariados se utilizó análisis de casos disponibles,
por lo que el denominador varió según la variable o comparación realizada. Para los
modelos multivariables de regresión logística binaria, regresión de Poisson con varianza
robusta y regresión lineal múltiple, se incluyeron únicamente los participantes con
datos completos para la variable dependiente y las covariables incorporadas en cada
modelo. El tamaño muestral efectivo de cada modelo se reportó junto con sus respectivos
resultados.
Entre los 653 participantes que aceptaron participar, 220 fueron hombres (33,7 %)
y 433 mujeres (66,3 %). La media de edad fue de 34,2 ± 8,88 años; fue similar entre
ambos grupos: 33,8 ± 8,97 el personal sanitario y 36,2 ± 8,14 el no sanitario. La
mediana de edad fue de 32 (28-39) años; el personal sanitario fue cinco años más joven
en mediana que el personal no sanitario, con la mayor diferencia de años entre hombres
(personal sanitario 29 años, no sanitario 37 años) que entre mujeres (personal sanitario
32 años, no sanitario 36 años). La Tabla 1 muestra las características de los trabajadores según el tipo de cargo. La diferencia
de edad entre los tipos de trabajo fue estadísticamente significativa (p = 0,001).
Tabla 1
Características de los trabajadores según el tipo de cargo
|
|
Todos los trabajadores
|
Sanitario
|
No Sanitario
|
|
|
(N = 653)
|
(n = 553)
|
(n = 100)
|
|
|
N
|
%
|
N
|
%
|
N
|
%
|
|
Sexo
|
|
|
|
|
|
|
|
Hombres
|
220
|
33,7
|
179
|
32,4
|
41
|
41,0
|
|
Mujeres
|
433
|
66,3
|
374
|
67,6
|
59
|
59,0
|
|
Edad {años}
|
653
|
|
|
|
|
|
|
Media (d. s.) ¥ |
34,2
|
(8,88)
|
33,8
|
(8,97)
|
36,2
|
(8,14)
|
|
Mediana (RIC) *
|
32,0
|
(28-39)
|
31,0
|
(27-38)
|
36,0
|
(29-42
|
|
IMO (kg/m2)
|
|
|
|
|
|
|
|
Bajo peso
|
4
|
0,6
|
4
|
0,7
|
0
|
0,0
|
|
Peso normal
|
160
|
24,5
|
140
|
25,3
|
20
|
20,0
|
|
Sobrepeso
|
282
|
43,2
|
237
|
42,9
|
45
|
45,0
|
|
Obesidad
|
207
|
31,7
|
172
|
31,1
|
35
|
35,0
|
|
Exposición solar
|
643
|
|
|
|
|
|
|
Sí
|
339
|
52,7
|
293
|
54,0
|
46
|
46,0
|
|
No
|
304
|
47,3
|
250
|
46,0
|
54
|
54,0
|
|
Actividad física
|
643
|
|
|
|
|
|
|
Vigorosa
|
33
|
5,1
|
26
|
4,8
|
7
|
7,0
|
|
Moderada
|
157
|
24,4
|
130
|
23,9
|
27
|
27,0
|
|
Ligera
|
228
|
35,5
|
194
|
35,7
|
34
|
34,0
|
|
Sedentaria
|
225
|
35,0
|
193
|
35,5
|
32
|
32,0
|
|
Tabaco*
|
641
|
|
|
|
|
|
|
Sí
|
86
|
13,4
|
68
|
12,5
|
18
|
18,2
|
|
No
|
555
|
86,6
|
474
|
87,5
|
81
|
81,8
|
|
Alcohol*
|
635
|
|
|
|
|
|
|
Sí
|
442
|
69,6
|
366
|
68,2
|
76
|
77,6
|
|
No
|
193
|
30,4
|
171
|
31,8
|
22
|
22,4
|
|
Calidad del sueño6 |
641
|
|
|
|
|
|
|
Bueno
|
275
|
42,9
|
231
|
42,7
|
44
|
44,0
|
|
Regular
|
292
|
45,6
|
246
|
45,5
|
46
|
46,0
|
|
Pobre
|
74
|
11,5
|
64
|
11,8
|
10
|
10,0
|
|
Vitamina D (ng/mL)
|
453
|
|
|
|
|
|
|
Deficiencia (< 12)
|
15
|
3,3
|
12
|
3,1
|
3
|
4,3
|
|
Insuficiencia (12 ~ < 20)
|
197
|
43,5
|
162
|
42,2
|
35
|
50,7
|
|
Suficiencia (> 20)
|
235
|
51,9
|
206
|
53,6
|
29
|
42,0
|
|
Riesgo de toxicidad (>100)
|
6
|
1,3
|
4
|
1,0
|
2
|
2,9
|
No se observaron diferencias estadísticamente significativas entre el IMC y el tipo
de cargo (p = 0,26). La prevalencia de sobrepeso fue similar entre el personal sanitario
(43,2 %) y el personal no sanitario (45 %), al igual que la prevalencia de obesidad
(31,3 % frente a 35 %), sin diferencias significativas. De manera similar, no se encontraron
diferencias significativas entre el tipo de cargo y variables como sexo, niveles de
actividad física, calidad del sueño en el último mes, exposición solar, concentraciones
séricas de vitamina D, ni consumo de tabaco y alcohol en los últimos 12 meses.
En el análisis comparativo no se observaron diferencias estadísticamente significativas
en el consumo de alcohol entre el personal sanitario y no sanitario (68,2 % vs. 77,6
%; p = 0,06), ni en la proporción de niveles normales de vitamina D (53,6 % vs. 42,0
%; p = 0,07). No obstante, descriptivamente, el personal sanitario presentó una menor
frecuencia de consumo de alcohol y una mayor proporción de niveles normales de vitamina
D. En la muestra total, se evidenció una alta prevalencia de insuficiencia de vitamina
D (43,5 %) y deficiencia (3,3 %).
Mediante la prueba t de Student se identificaron diferencias significativas entre
el tipo de cargo y algunas medidas antropométricas:
-
Circunferencia de cintura (n = 648): el personal sanitario presentó un valor medio
de 91,2 cm, en comparación con 94,6 cm en el personal no sanitario (p = 0,01), con
un tamaño del efecto pequeño (d de Cohen = 0,27; IC 95 %: 0,06-0,49).
-
Nivel de grasa visceral: el personal sanitario mostró un nivel medio de 8,3, mientras
que el personal no sanitario presentó 9,5 (p = 0,01), con un tamaño del efecto pequeño
a moderado (d de Cohen = 0,32; IC 95 %: 0,10-0,53).
-
No se detectaron diferencias significativas en la tasa anual de ausentismo entre ambos
tipos de cargo, según la prueba U de Mann-Whitney.
Un notable 74,9 % de los trabajadores fue clasificado con sobrepeso u obesidad, de
los cuales el 43,2 % correspondió a sobrepeso y el 31,7 % a obesidad. En la Figura 1 se muestra la distribución del IMC según sexo y tipo de cargo.
Figura 1
Distribución del IMC según sexo y tipo de cargo.
El tamaño muestral efectivo varió según la disponibilidad de datos para cada variable.
En los análisis descriptivos y bivariados, la mayoría de las variables tuvo información
disponible para 635 a 653 participantes; específicamente, sexo, edad e IMC estuvieron
disponibles para 653 trabajadores; exposición solar y actividad física para 643; tabaco
y calidad del sueño para 641; alcohol para 635, y circunferencia de cintura para 648.
La principal excepción fue vitamina D, disponible en 453 trabajadores. En los modelos
multivariados, el análisis por casos completos redujo el tamaño muestral efectivo
a 366-367 participantes, como se detalla en los anexos 2 y 3.
En el análisis de regresión logística binaria, se identificaron factores estadísticamente
significativos asociados con una mayor probabilidad de presentar sobrepeso u obesidad
(Figura 2).
Figura 2
Forest plot
o diagrama de bosque de los factores asociados con el sobrepeso/obesidad por regresión
logística binaria.
Nota: Los estimadores representan el log odds de "Sobrepeso/Obesidad = Sí" vs. "Sobrepeso/Obesidad
= No". Escala logarítmica. A.F. = Actividad Física
Cada año adicional de edad se asoció con un incremento del 4,8 % en las odds de sobrepeso/obesidad (OR = 1,048; IC 95 %: 1,014-1,083; p = 0,005). Asimismo, los
hombres presentaron aproximadamente tres veces más odds de sobrepeso/obesidad que las mujeres (OR = 2,989; IC 95 %: 1,548-5,771; p = 0,001).
En comparación con el sedentarismo, la actividad física moderada se asoció con menos
odds de sobrepeso/ obesidad (OR = 0,443; IC 95 %: 0,220-0,893; p = 0,023). Sin embargo,
la actividad física vigorosa no estuvo asociada, probablemente debido al poco número
de trabajadores en esta categoría, lo que podría limitar la precisión. Tampoco se
observaron asociaciones significativas con el tipo de alcohol consumido, la frecuencia
de consumo de tabaco, los niveles de vitamina D, la calidad del sueño, el ausentismo
ni el tipo de cargo (p > 0,05 en todos los casos). En conjunto, el modelo fue globalmente
significativo (x2 = 27,1; gl = 15; p = 0,028), aunque su capacidad explicativa fue modesta (R2 de McFadden = 0,067; R2 de Nagelkerke = 0,107). El modelo incluyó n = 367 participantes con datos completos
para la variable dependiente y todas las covariables incluidas.
Dado que el desenlace principal presentó una alta prevalencia, se empleó regresión
de Poisson con varianza robusta (Figura 3), considerado por ende el análisis principal, para estimar razones de prevalencia
ajustadas (RPa) e intervalos de confianza del 95 %. La regresión logística binaria
se utilizó inicialmente para explorar asociaciones, pero los odds ratios fueron interpretados con cautela debido a que, en desenlaces frecuentes, pueden sobreestimar
la magnitud de la asociación en comparación con las razones de prevalencia.
Figura 3
Forest plot
o diagrama de bosque de los factores asociados con el sobrepeso/obesidad por regresión
de Poisson con varianza robusta.
En el modelo multivariable de regresión de Poisson (n = 367) con varianza robusta,
ajustado por sexo, actividad física, tipo de alcohol, frecuencia de fumar, calidad
de sueño, tipo de cargo, edad, vitamina D y porcentaje de ausentismo anual, para evaluar
los factores asociados con sobrepeso/obesidad, se observó que el sexo femenino se
asoció con una menor razón de prevalencia de sobrepeso/obesidad en comparación con
el masculino (RPa: 0,79; IC 95 %: 0,69-0,91; p = 0,001). Asimismo, la edad se asoció
positivamente con el desenlace, y se observó un incremento de 0,9 % en la razón de
prevalencia por cada año adicional de edad (RPa: 1,009; IC 95 %: 1,004-1,015; p =
0,001). Aunque el efecto global de la actividad física no fue estadísticamente significativo
(p = 0,102), la categoría de actividad física moderada mostró una menor razón de prevalencia
de sobrepeso/obesidad en comparación con el grupo sedentario (RPa: 0,83; IC 95 %:
0,71-0,97; p = 0,021). Cabe recalcar que, así como en el modelo de regresión logística,
la actividad física vigorosa no estuvo asociada, probablemente debido al poco número
de trabajadores en esta categoría, lo que podría limitar la precisión. No se observaron
asociaciones estadísticamente significativas con el tipo de alcohol consumido, la
frecuencia de fumar, la calidad del sueño, el tipo de cargo, los niveles de vitamina
D ni el porcentaje de ausentismo anual. En el Anexo 2 se puede ver la N efectiva y los datos faltantes por variable de este análisis de
regresión de Poisson.
Se realizó un análisis de regresión lineal múltiple, previa comprobación de supuestos,
para determinar qué variables estaban asociadas con el nivel de grasa visceral (Figura 4).
Figura 4
Coefficient plot
o diagrama de coeficientes de los factores asociados con el nivel de grasa visceral
por regresión lineal múltiple.
Nota: Los coeficientes ß representan el cambio en el nivel de grasa visceral por cada
unidad de incremento en el factor asociado. A.F. = Actividad Física, Hb = Hemoglobina
En el modelo de regresión lineal múltiple, la edad se asoció positivamente con el
nivel de grasa visceral, y se observó un incremento promedio de 0,13 puntos por cada
año adicional de edad (B = 0,1295; IC 95 %: 0,0970 a 0,1620; p < 0,001). De igual
forma, el sexo masculino, en comparación con el femenino, se asoció con un aumento
promedio de 4,40 puntos en el nivel de grasa visceral (B = 4,4049; IC 95 %: 3,7289
a 5,0810; p < 0,001). La vitamina D disminuida (< 20 ng/mL, incluye tanto a la insuficiencia
como a la deficiencia), en comparación con niveles normales, también se asoció con
mayores valores promedio de grasa visceral, aunque con una estimación menos precisa
y cercana al valor nulo (B = 0,6107; IC 95 %: 0,0423 a 1,1790; p = 0,035). De igual
manera, la hemoglobina glicosilada se asoció positivamente con el nivel de grasa visceral
(B = 0,8384; IC 95 %: 0,3222 a 1,3550; p = 0,002). No se observaron asociaciones estadísticamente
significativas para tipo de trabajo, tipo de alcohol, actividad física, tabaquismo
ni calidad del sueño. En particular, las categorías de calidad de sueño regular (p
= 0,06) y mala (p = 0,09), en comparación con buena calidad de sueño, presentaron
intervalos de confianza que incluyeron el valor nulo, por lo que no se consideraron
asociadas de forma estadísticamente significativa con el nivel de grasa visceral.
El modelo explicó el 44,9 % de la variabilidad del nivel de grasa visceral (R2 = 0,449).
El ajuste global fue significativo (F [15,350] = 19,0; p < 0,001). El análisis se
realizó con n = 366 participantes con datos completos para la variable dependiente
y los factores asociados incluidos en el modelo. En el Anexo 3 se puede ver la N efectiva y los datos faltantes por variable de este análisis de
regresión lineal múltiple.
4. Discusión
Este estudio examinó la prevalencia de sobrepeso y obesidad, así como los factores
asociados, entre el personal sanitario y no sanitario de un hospital oncológico en
Ecuador. Los hallazgos indican una alta prevalencia de sobrepeso y obesidad (74,9
%), consistente con las tendencias globales observadas entre los trabajadores de la
salud [1,23]. A pesar de la ausencia de diferencias significativas en el IMC según el tipo de
trabajo, las disparidades en la circunferencia de cintura y el nivel de grasa visceral
subrayan la importancia de implementar intervenciones dirigidas para reducir la obesidad
central en el personal no sanitario.
La elevada prevalencia de sobrepeso y obesidad es comparable a la reportada en estudios
regionales de América Latina, donde estas condiciones han alcanzado niveles epidémicos
debido a cambios en el estilo de vida, incluidos el sedentarismo y los patrones dietéticos
poco saludables [24,25]. Entre los trabajadores de la salud, la prevalencia de obesidad fue mayor que la
reportada en otros entornos hospitalarios [26-29], lo que podría reflejar tendencias regionales.
Cabe señalar que no se encontraron asociaciones significativas entre el tipo de trabajo
y factores como los niveles de actividad física, la calidad del sueño o las concentraciones
séricas de vitamina D. No obstante, las tendencias hacia un menor consumo de alcohol
y niveles más altos de vitamina D entre el personal sanitario podrían indicar diferencias
modestas en el estilo de vida. La alta prevalencia global de insuficiencia (43,5 %)
y deficiencia (3,3 %) de vitamina D concuerda con hallazgos de otros estudios, lo
que pone de manifiesto el desafío mundial de abordar la hipovitaminosis D [30,31]. La evidencia sugiere que la vitamina D desempeña un papel crítico en la salud metabólica
y que su deficiencia puede exacerbar la inflamación e incrementar el riesgo de comorbilidades
relacionadas con la obesidad [32].
El análisis de regresión logística y la regresión de Poisson con varianza robusta
identificaron la edad y el sexo como factores asociados a sobrepeso y obesidad, aunque
con precisión limitada. Estos hallazgos son consistentes con la literatura, que muestra
que la edad y el sexo influyen no solo en la distribución y expresión de la adiposidad,
sino también en la magnitud y el patrón del riesgo cardiometabólico asociado, incluido
el síndrome metabólico, hipertensión, diabetes y dislipidemia [33-36].
En el análisis de regresión lineal múltiple, la edad y el sexo se asociaron de manera
independiente con el nivel de grasa visceral. Asimismo, los niveles de vitamina D
mostraron una asociación inversa con el nivel de grasa visceral, de modo que concentraciones
más bajas de vitamina D se relacionaron con mayores valores de grasa visceral, tras
el ajuste por las demás variables incluidas en el modelo. Este hallazgo es compatible
con investigaciones previas que han descrito asociaciones entre el estado de vitamina
D, la adiposidad y procesos inflamatorios [37-39]. Sin embargo, debido al diseño transversal del estudio, estos resultados deben interpretarse
como asociaciones y no permiten establecer causalidad ni atribuir un efecto protector
de la vitamina D sobre la grasa visceral. Se requieren estudios longitudinales o de
intervención para esclarecer la dirección y los posibles mecanismos de esta relación.
La ausencia de diferencias significativas en las tasas de ausentismo entre el personal
sanitario y no sanitario podría reflejar factores de estrés ocupacional compartidos
o desafíos comunes dentro del entorno hospitalario. No obstante, los tamaños de efecto
pequeños a moderados observados en la circunferencia de cintura y el nivel de grasa
visceral entre los tipos de trabajo resaltan la necesidad de implementar programas
de bienestar laboral personalizados que atiendan las necesidades específicas del personal
sanitario y no sanitario.
Sin embargo, la obesidad es un fenómeno multifactorial en el que intervienen determinantes
biológicos, conductuales, ambientales y sociales. Por ello, aunque en el presente
estudio algunas variables mostraron asociación con sobrepeso/obesidad, la capacidad
explicativa del modelo fue limitada, lo que sugiere que otros factores no medidos
también podrían contribuir al desenlace, como los patrones dietéticos, el balance
energético, la predisposición genética, el estrés, las condiciones laborales y otros
determinantes del entorno.
4.1 Fortalezas y limitaciones
Entre las fortalezas del estudio se incluyen un tamaño de muestra adecuado para describir
las características de los trabajadores participantes, una metodología rigurosa y
el uso de herramientas validadas para la medición antropométrica y de la composición
corporal. No obstante, es necesario reconocer ciertas limitaciones. El diseño transversal
impide realizar inferencias causales, y la dependencia de datos autorreportados para
algunas variables, como la actividad física y el consumo de alcohol, puede introducir
sesgos. Se requieren estudios longitudinales futuros para establecer relaciones causales
y explorar el impacto de intervenciones dirigidas sobre los desenlaces de salud del
personal sanitario y no sanitario.
Una limitación inherente de nuestro estudio es que se basó exclusivamente en el IMC
como indicador de exceso de peso. En enero de 2025, la Comisión de The Lancet Diabetes
& Endocrinology [40] publicó un nuevo marco diagnóstico que distingue la "obesidad preclínica" de la
"obesidad clínica", e incorporó la distribución de la grasa y la presencia de disfunción
orgánica para definir la enfermedad. Los resultados de este estudio siguen siendo
válidos para estimar la magnitud del problema en 2023; sin embargo, futuros estudios
deberían aplicar estos criterios ampliados para identificar con mayor precisión la
carga de obesidad clínica y orientar intervenciones específicas.
Otra limitación relevante del estudio fue la proporción considerable de trabajadores
elegibles que no participaron. Aunque la tasa de completitud del cuestionario fue
alta entre quienes aceptaron participar, la tasa de participación respecto a la población
elegible fue del 49,2 %. Esto podría introducir sesgo de no respuesta si los trabajadores
que no participaron diferían sistemáticamente de los participantes en variables relacionadas
con el estado nutricional, el riesgo cardiometabólico, el sexo, la edad, el tipo de
ocupación o los hábitos de salud. No fue posible comparar las características de los
participantes y no participantes debido a la ausencia de información individual disponible
para los trabajadores que declinaron participar. En consecuencia, los resultados deben
interpretarse con cautela y su generalización a todos los trabajadores de la institución
debe ser limitada. No obstante, la muestra final incluyó tanto personal sanitario
como no sanitario, lo que permitió explorar diferencias entre grupos ocupacionales
dentro de la población participante.
Otra limitación del estudio fue que el nivel de grasa visceral estimado por el OMRON
HBF-514C fue tratado como variable dependiente continua en el modelo de regresión
lineal múltiple, a pesar de corresponder a una escala ordinal de 1 a 30 niveles y
no a un porcentaje real de grasa visceral. Esta decisión puede afectar la interpretación
de los coeficientes, dado que las diferencias entre niveles consecutivos no necesariamente
representan cambios equivalentes en la grasa visceral real. Por ello, los resultados
del modelo multivariado, realizado en 366 participantes, deben interpretarse con cautela
como una aproximación exploratoria de los factores asociados al nivel de grasa visceral.
Por último, una limitación importante fue el número de datos faltantes en algunas
variables. Se utilizó análisis de casos disponibles para los análisis descriptivos
y bivariados, y análisis de casos completos para los modelos multivariables. Por tanto,
el tamaño muestral efectivo varió entre análisis. Este enfoque puede reducir la precisión
estadística y producir sesgo si los datos faltantes no ocurrieron de manera aleatoria.
5. Conclusiones
Se plantea la necesidad de desarrollar estudios futuros que evalúen intervenciones
orientadas a reducir la carga de sobrepeso y obesidad entre los trabajadores hospitalarios,
considerando la alta prevalencia observada en esta población. Asimismo, según los
hallazgos de cohortes prospectivas, estas investigaciones de intervención o seguimiento
deberían considerar estrategias dirigidas a promover la actividad física, mejorar
los hábitos alimentarios y abordar la insuficiencia de vitamina D, cuya alta frecuencia
también fue evidenciada en el presente estudio.
De igual manera, en concordancia con lo descrito en la literatura, las intervenciones
personalizadas dirigidas a grupos con mayor circunferencia de cintura y mayor nivel
de grasa visceral, como el personal no sanitario, podrían generar beneficios para
la salud y contribuir a mejorar la productividad laboral. El sobrepeso y la obesidad
mostraron una asociación consistente con la edad y el sexo, identificando a los hombres
y a los trabajadores de mayor edad como grupos con mayor carga del desenlace. Aunque
el diseño transversal impide inferir causalidad, estos resultados pueden orientar
estrategias institucionales de prevención y seguimiento cardiometabólico focalizadas
en los grupos de mayor prevalencia.